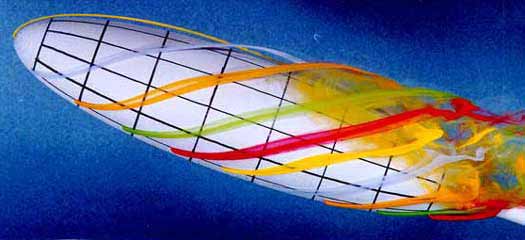
 Flow visualization is an incredibly valuable tool in an engineers/scientists toolbox. It allows a better understanding of the flow characteristics in a device or system by allowing the actual flow patterns to be seen. It can be used to quickly identify a problem that could hamper, if not severely limit, the performance of a device/system. Often the problem is due to the fluid not behaving as the engineer expected.
Flow visualization can be used to understand and optimize the design of devices involving the flow of liquids and gases. Most fluid flow is transparent, and the actual fluid motion is not readily apparent to the human eye. In order to visually examine the motion of such fluids it is necessary to use various techniques that will allow the flow of the fluid to be observed.
Flometrics has used flow visualization for studying the flow through valves, manifolds, pumps, flow conditioner devices, flow meters, stented arteries, fluid and gas delivery systems, biological reactors, and many other devices. It can show where the areas of high and low speed flow are, and where flow separation, recirculation and turbulent zones occur. Once the flow visualization has been accomplished, Flometrics can alter the configuration to change the flow pattern, or make measurements at points of interest in the flow. If a flow problem is quickly identified, a great deal of money can be saved by eliminating investigative work and multiple design iterations. As most engineering managers know, “guesswork” can be expensive! In many cases it is quicker to run through a series of varations of a design with flow visualization than with CFD, where each computer run can take many hours.
Flometrics can help you decide what type of flow visualization is right for you. We have at our disposal laser sheet light systems, hydrogen bubble techniques, Schlieren, or traditional dye or smoke techniques. Our modeling shop can quickly create dimensionally accurate models of your device or system as necessary to perform the flow visualization on.
