Case Study:
Flow Visualization of Arteries
Client:
In-House
Project Scope:
Research & Development
Methods:
Flow Visualization, Fluid Dynamics, Design & Testing
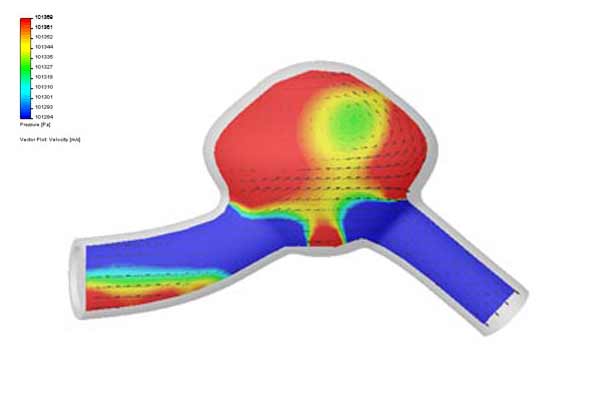
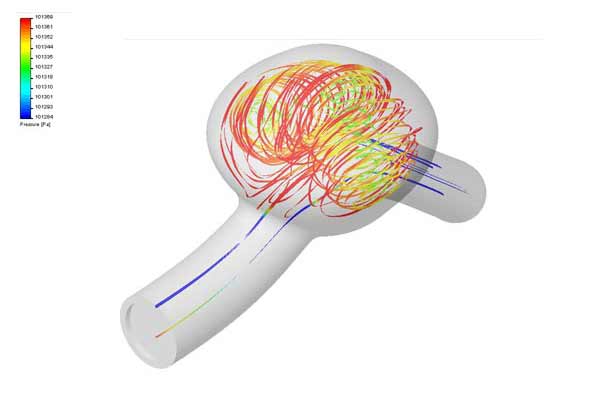
Computed Flow Through Cerebral Aneurysm
Particle paths of the computed flow through a cerebral aneurysm. The flow was simulated using a commercial finite element code.
The second image is a cross section showing the pressure contours in the cerebral aneurysm. By combining CFD and flow visualization, Flometrics can analyze flows with accuracy and confidence.
Flow Visualization of Arteries
Flometrics has developed a technique for visualization of the flow within artificial arteries. This allow manufacturers of stents, valves and atherectomy devices to see how their devices affect the flow of blood in the body.
We have developed silicone rubber arteries with realistic compliance, curvature and excellent visibility. We can supply arbitrary pressure waveforms with our pressure pulse generator.
The flow within the artery is visualized using a proprietary technique similar to the laser sheet light technique. We can show the flow pattern around catheters, valves, stents, balloons and grafts with this technique.
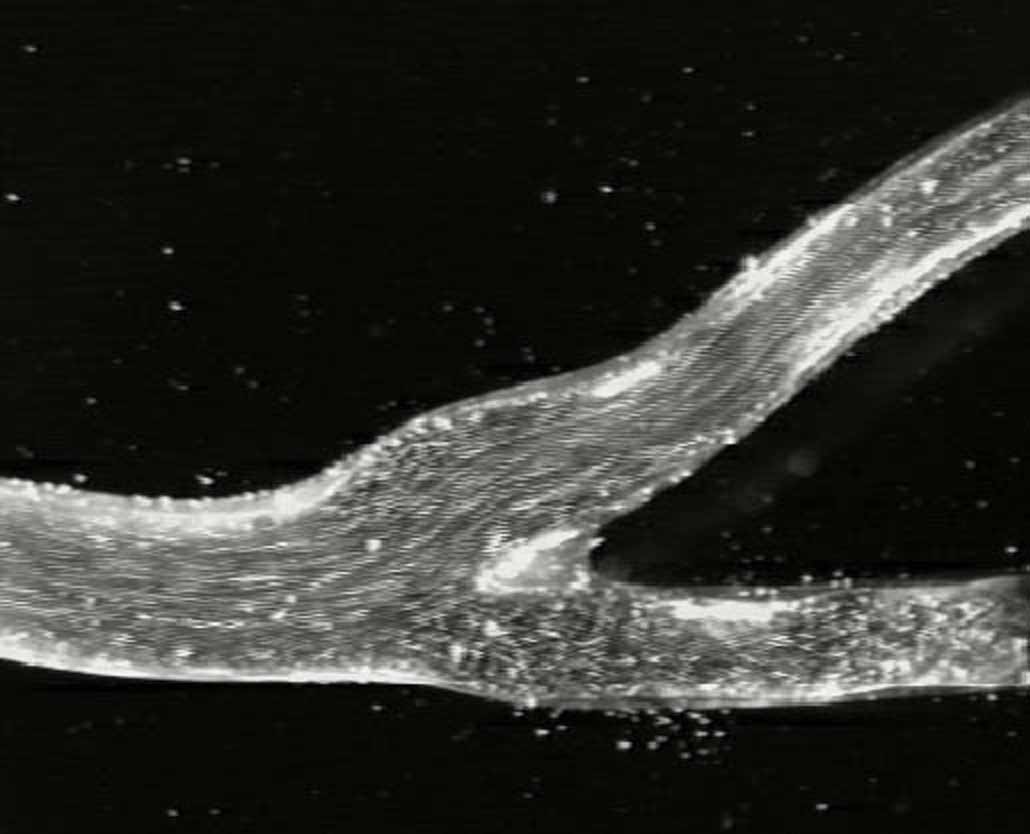
Shown at right is a photo of the flow pattern in a carotid bifurcation. (Thanks to Dr. David Levy for the artery model and advice.)
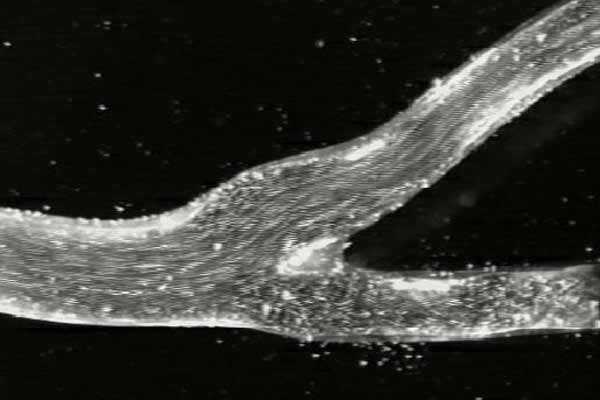
In the movie below, the flow in an aneurysm is visualized. The slow flow rate and low shear levels inside the aneurysm may stimulate the growth of the aneurysm.
These flow visualizations can be valuable in showing the efficacy of medical devices and proving out conceptual design without expensive clinical studies. For situations like flow in an artery, flow visualization shows the flow pattern quickly and accurately.
The flow within the artery is visualized using a proprietary technique similar to the laser sheet light technique. We can show the flow pattern around catheters, valves, stents, balloons and grafts with this technique.


